Katelyn Lee is Online
Katelyn Lee
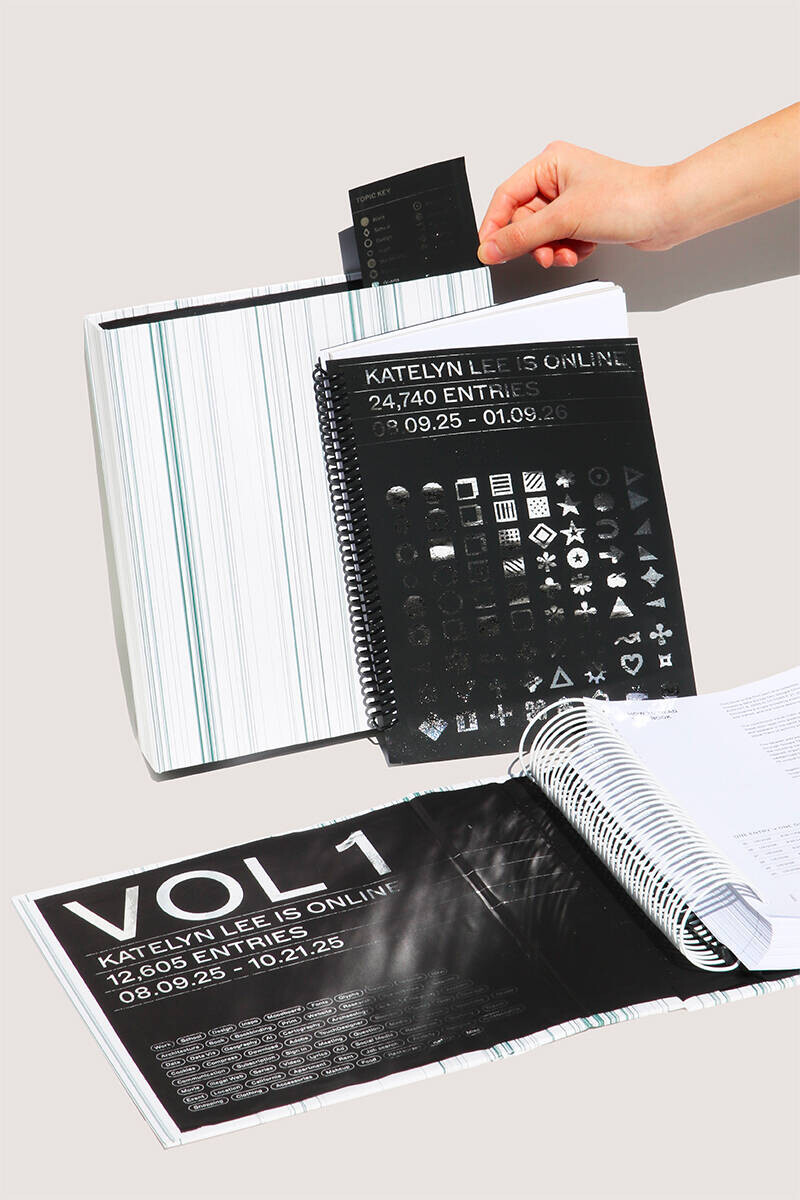
This project documents and analyzes six months of my personal web browsing history, treating digital behavior as a form of observable record. As daily life increasingly unfolds across digital environments, the traces we leave online function as a parallel layer of lived experience. This project explores what happens when those digital traces are translated into physical form.
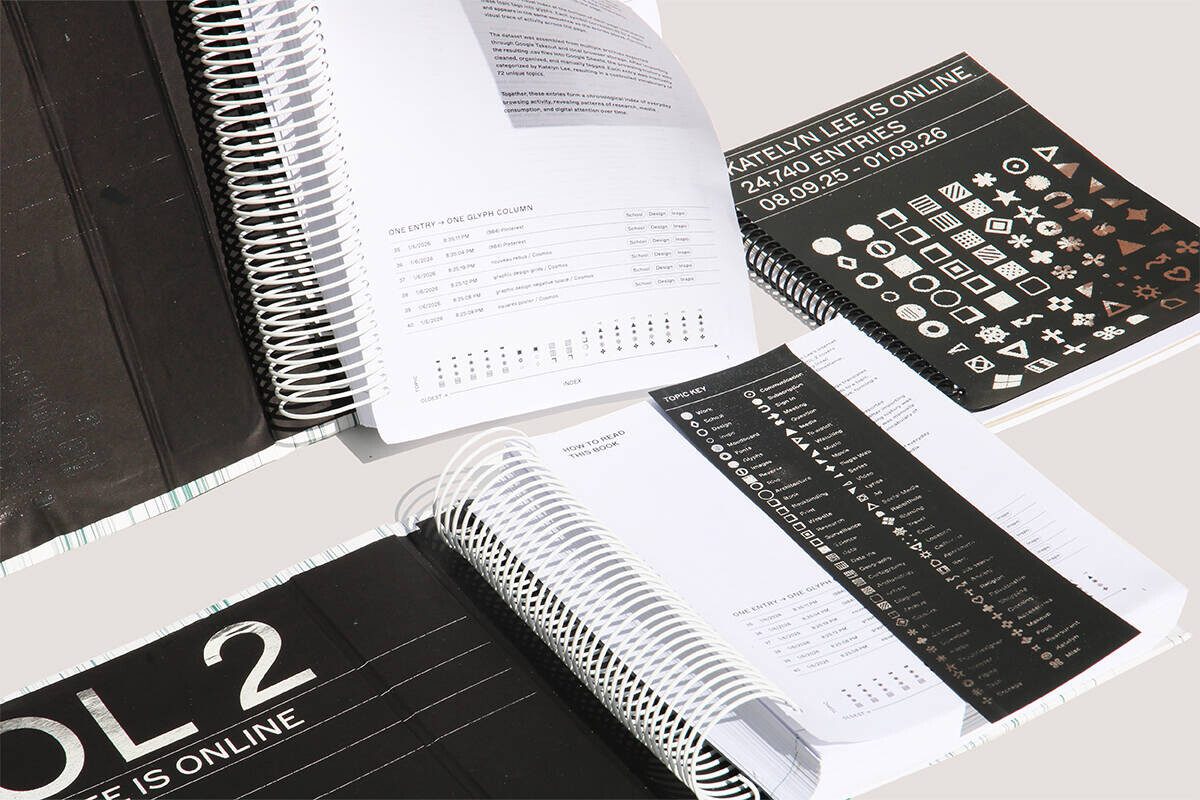
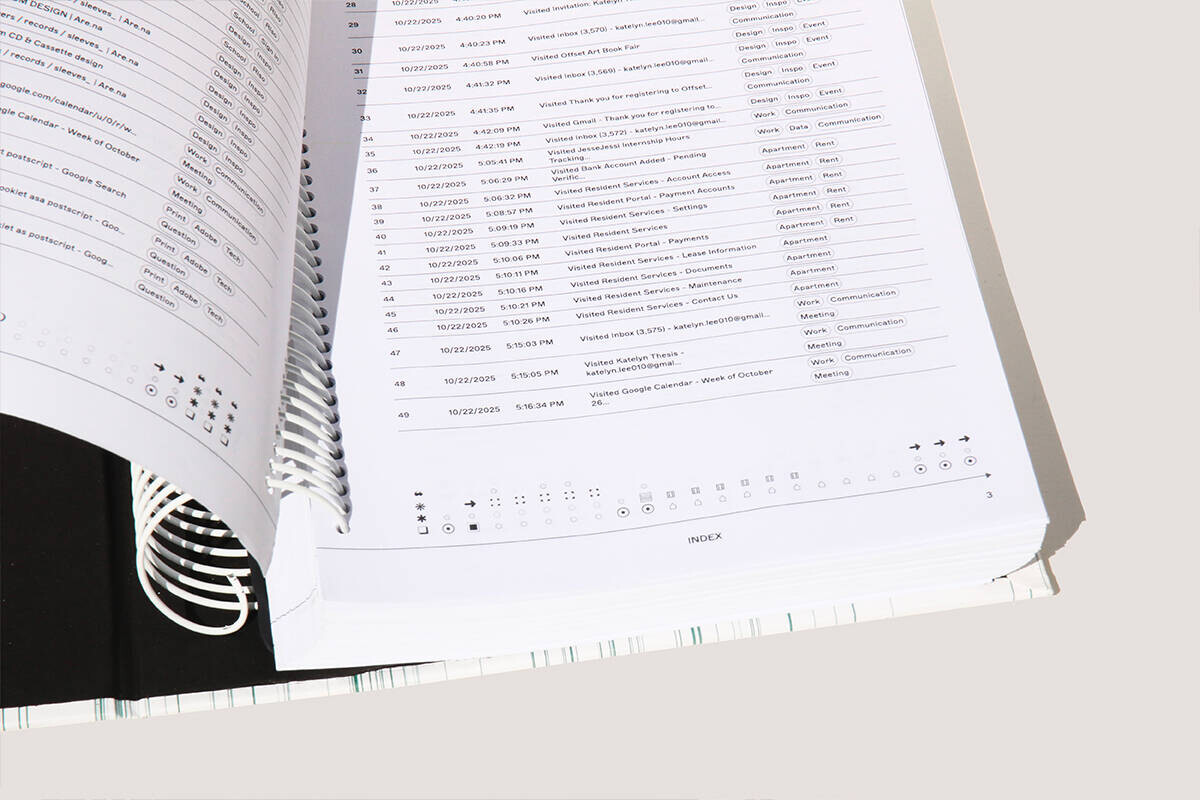
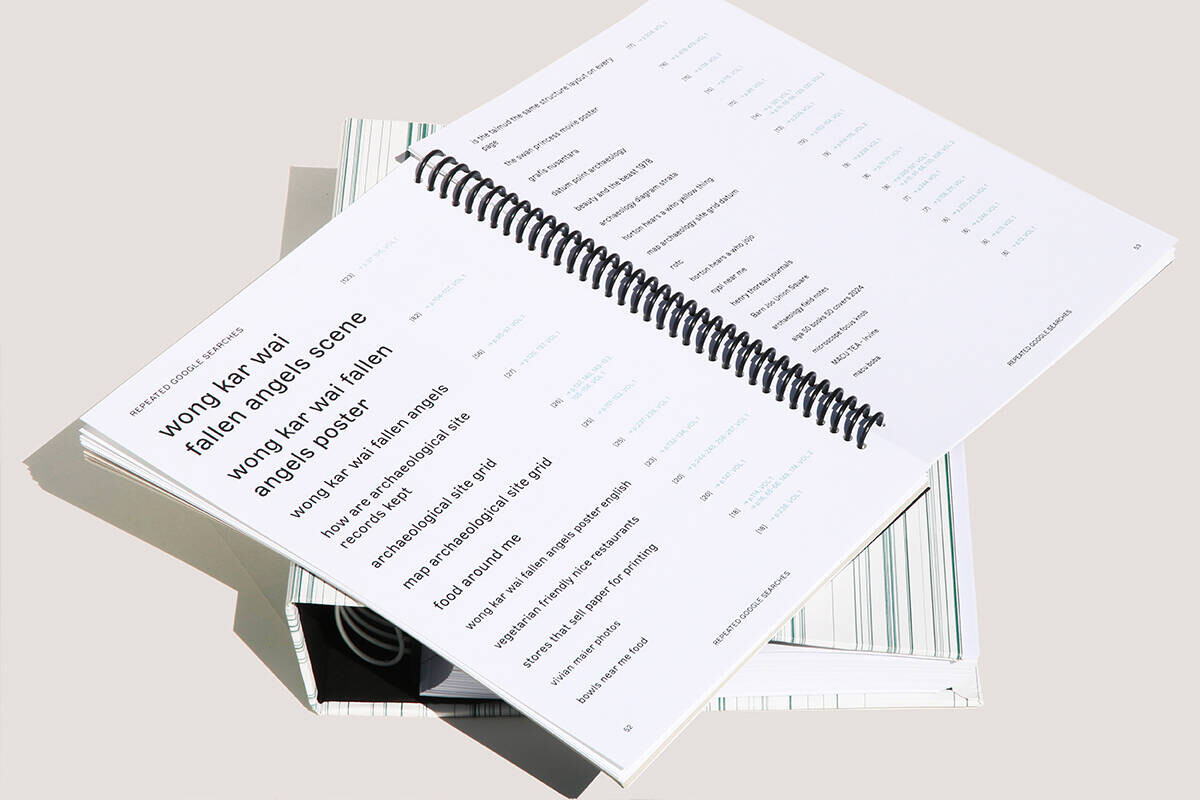
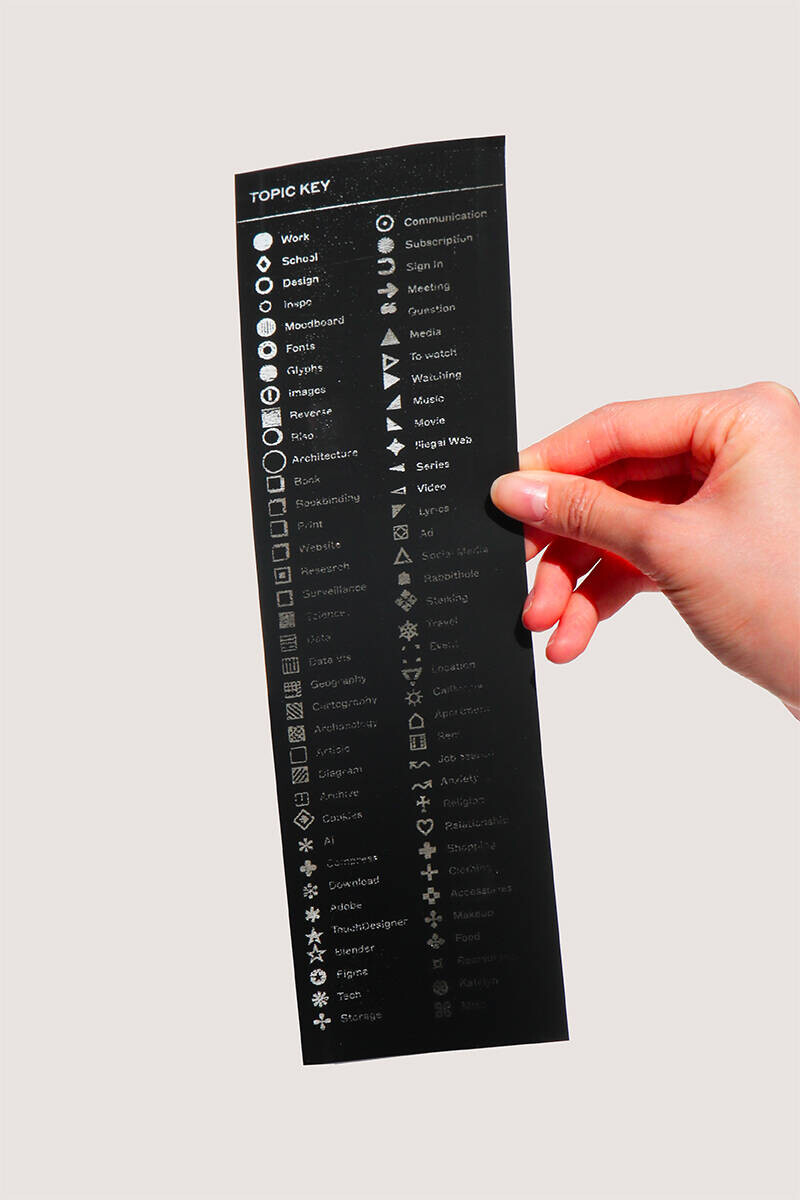
Using exported browser history data, I compiled and examined 24,740 individual entries spanning six months of online activity. The dataset was organized, indexed, and analyzed to identify patterns in time, frequency, and topic. A custom topic key was developed to classify and encode browsing behavior, structuring the dataset into legible categories. These patterns were then visualized through a series of data-driven graphics that map when, how often, and what types of information were accessed.
The entire system was built using HTML, CSS, and Paged.js, allowing the browser to function as both a computational and publishing tool. The resulting work exists across multiple formats: three books, infographic posters, and a website. Two 500 page index volumes catalog the raw browsing records, while a data visualization book analyzes the dataset through charts, temporal diagrams, and topic mapping. The visualizations are extended into larger and interactive formats through a web interface and posters.
By converting browser history into printed artifacts and visual systems, the project reframes personal browsing data as something that can be examined, archived, and physically encountered. In doing so, it reflects on how digital behavior accumulates over time and how the intangible structures of online life can be documented and made tangible.